
You’ve been itching to use Google Analytics, taking the time to set it up, creating your account, and adding the code to the site. But when you log in the first time, you may not know what to find where! With multiple tabs and features, Google Analytics can be overwhelming for a beginner; that’s why we’re breaking it down for you. Here are the key features of Google Analytics to help you get started.
Homepage
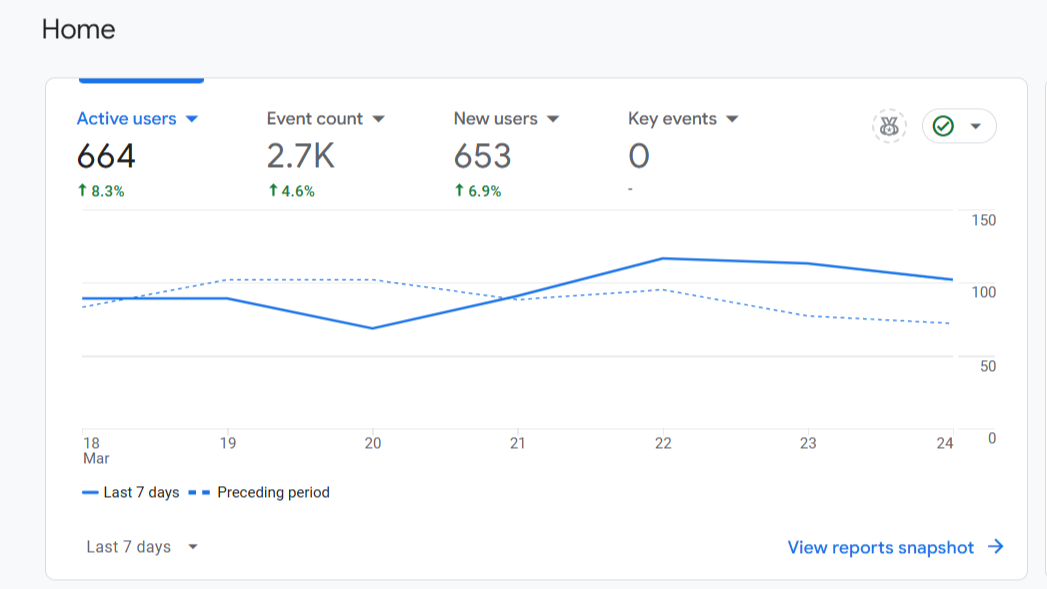
The homepage of Google Analytics is where you’ll have all of your key data at a glance. This is especially useful for those who don’t have much time and just want an overview of how the website is performing. Want to view the data for today? It's possible. Maybe yesterday’s? All there for you to see. You have the option to select different date ranges, whether it’s the past week or the past year.
At first glance, you have a graph of your users. On the right is more detailed data on active users in the last 30 minutes, active users per minute, and where they’re coming from.
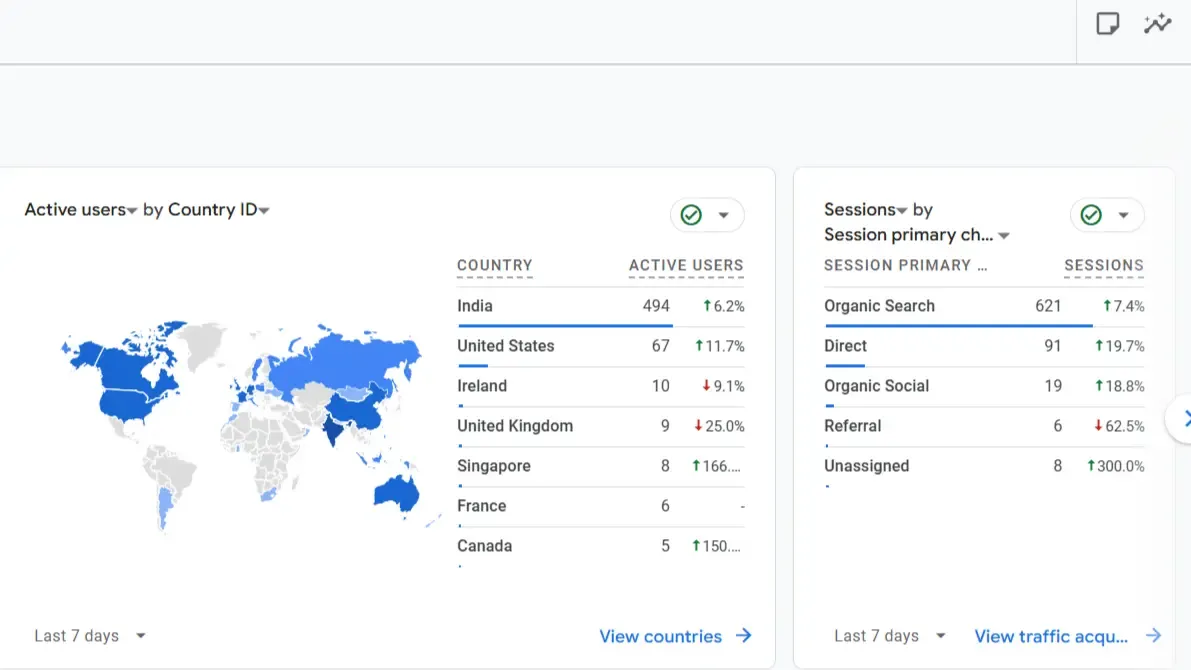
Scrolling down, you’ll see one of the coolest features of Google Analytics - the geographies of various users i.e. which countries people are visiting your website from. This sort of data is highly valuable, particularly for developing different marketing strategies that cater to these users.
If you click on “View Countries”, it takes you to a new page where you get even deeper specifics, such as engagement rates and the number of new users per country. Again, the date range can be adjusted here.
At the bottom of the homepage, there will be personalized insights and recommendations based on your website data. Though computer-generated, they help ensure you won’t be empty-handed at your next meeting!
Reports
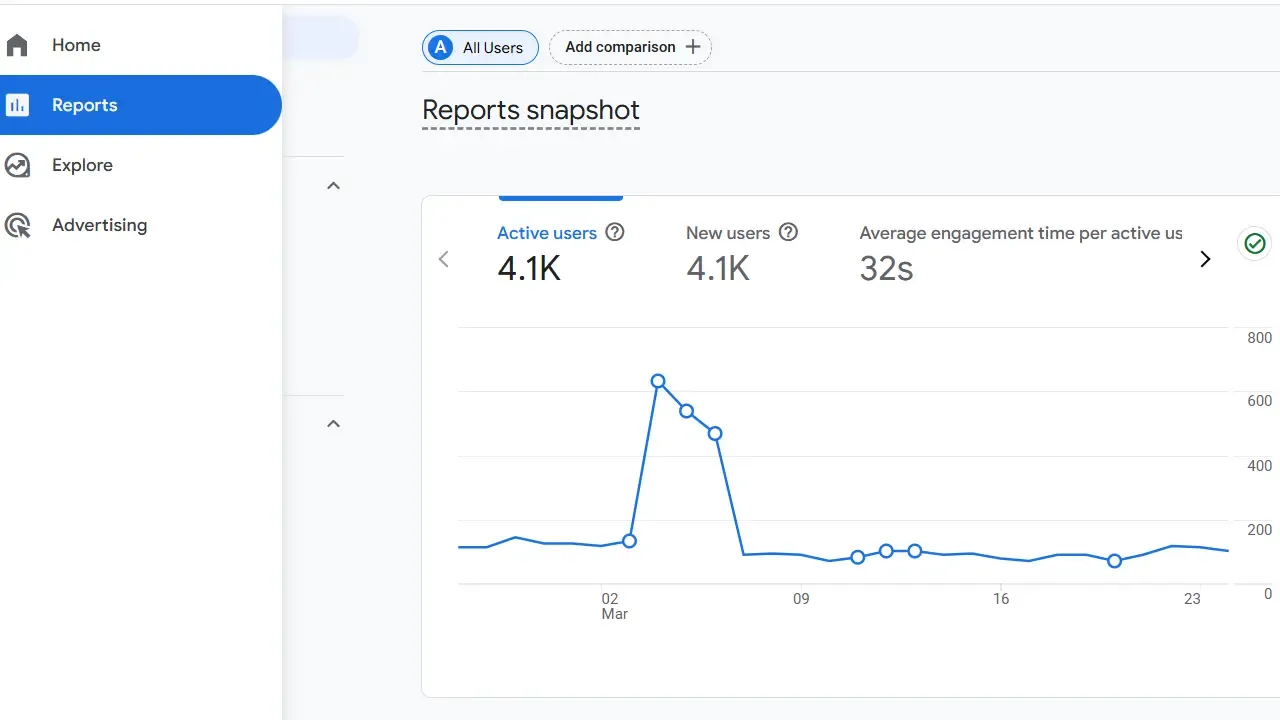
The reports tab in Google Analytics, where you can find ultra-refined data, is where all the fun is. Right at the top of this section is a report snapshot; like everywhere else, the date range is adjustable. A graph showing active users, new users, and average engagement time can be viewed as well.
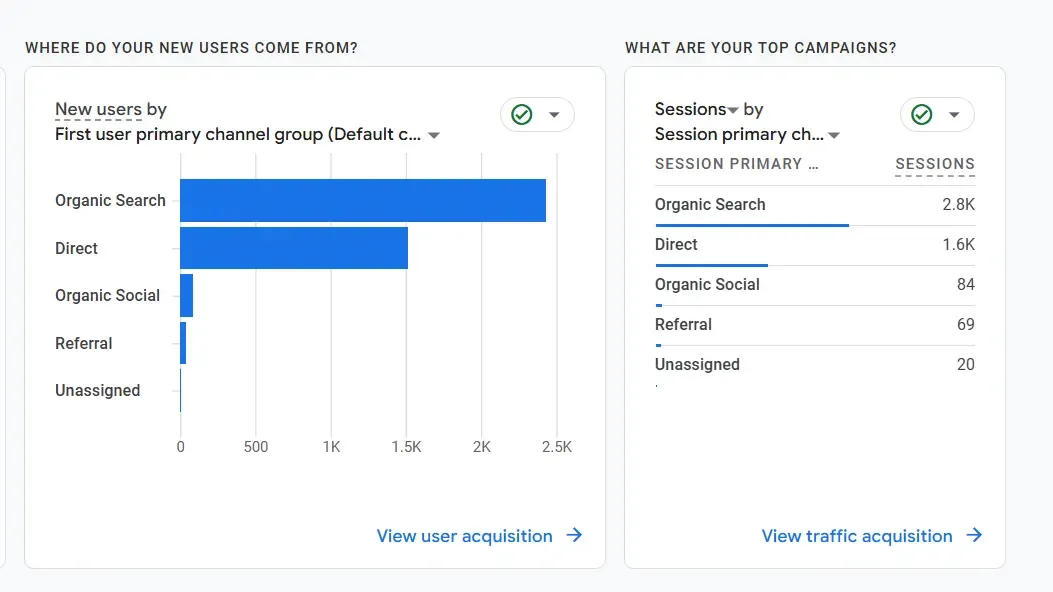
Further down, you’ll get to see exactly how users come to your site. These could be directly, through organic searches, or referrals. You can click on the arrows next to User Acquisition (how users find your site for the first time) and Traffic Acquisition (where new sessions come from, regardless of if it’s a new or returning user) for detailed insights. These are all important metrics of your website’s performance.
Keep scrolling, and you’ll spot data on the pages and screens that get the most views. You’ll get a pretty good idea of what’s working and what isn’t alongside your user retention; based on this, you can plan for certain changes across your website.
The reports tab has another section called ‘Realtime Overview’ that shows you how the website is performing in the current moment. You’ll get to see data like the active users, where they’re coming from, and what pages they’re visiting. Those with a lot of time on their hands will certainly love this section here!
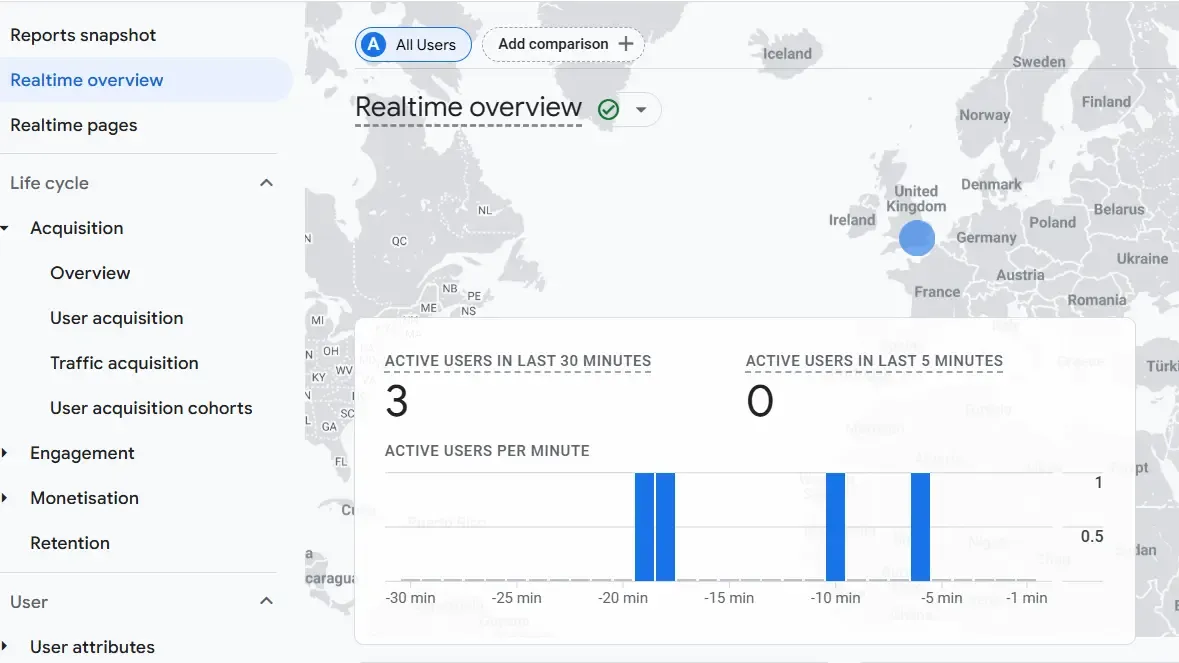
The other sections of the report tab provide precise data on engagement, acquisition, and retention. You can also view user demographic details like city, gender, interests, and age, and what devices they used to visit your website.
Explore
Explorations is a handy feature offered by Google Analytics. They help you apply the data obtained from your website in a number of different ways. Consider them an automated form of presenting data that saves you lots of time. Explorations visualize your data in forms such as graphs, pie charts, etc.
The template gallery can help you choose a module to begin your visualization. These are divided into three main categories - Techniques, Use Cases, and Industries.
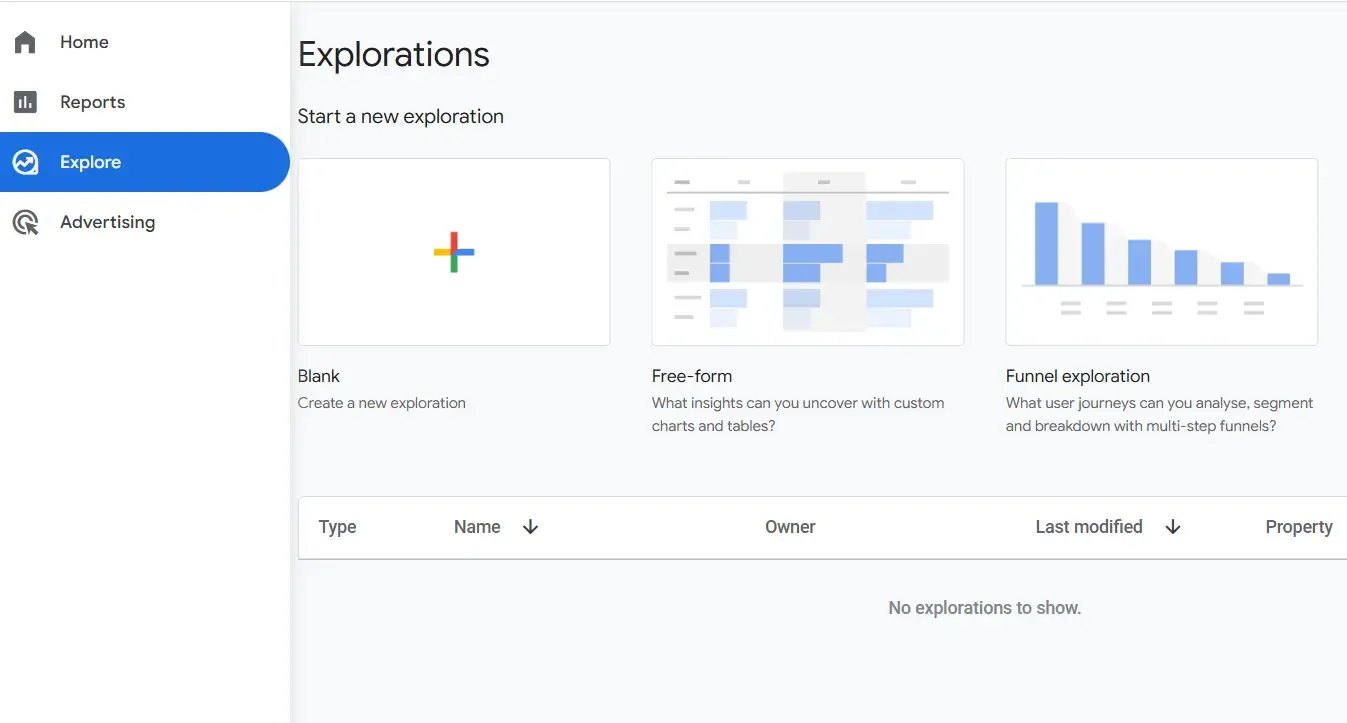
Techniques has the most templates, divided as follows:
- Free-Form Exploration - These essentially help you customize the data in a variety of different ways, such as tables and pie charts, making it visually aesthetic.
- Funnel Exploration - In this, users' movements through a set conversion tunnel are explored, based on what has been analyzed on your website.
- Path Exploration - It examines the way users navigate your website. It shows both linear movements from start to end point as well as meandering patterns. Through segment overlap, different user segments can be compared to observe common patterns between each of them.
- User Explorer - It takes a deep dive into the behavior of individual users, based on their interactions and viewing patterns on the website.
- Cohort Exploration - It clubs users based on common patterns and shows insights into their behavior and how it could change.
- User Lifetime - This shows how users interacted with the site for their entire duration on it over time, and how they can be retained further.
'Use Cases' comprises Acquisition, User Behavior, and Key Events; 'Industries' simply caters to those who have either e-commerce or gaming as part of their sites.
Advertising
The advertising section of Google Analytics gives different kinds of data related to your website campaigns. You can view the impact of paid and organic channels on conversions. It even lists how many touchpoints on the website it takes to convert users. Most importantly, you get to see how much revenue has been generated through your campaign.
Pro Tip: For a beginner, we recommend familiarizing yourself with the Homepage and the Reports tab of Google Analytics. That’s where you’re going to find the goldmine of data that’ll help you figure out what’s working and what needs an update.
Summing Up
Google Analytics has proven itself to be a godsend for website owners. While there may be those who would just be happy to see the exact number of visitors to their site, Google Analytics does so much more than that. It offers demographic details, engagement rates, geographies, traffic-per-page, and customized reports.
The best part? This is all in the free version. By comprehensively tracking your website performance, Google Analytics helps you make significant website decisions that can potentially take your business to the next level!
FAQs
What is Google Analytics for?
Google Analytics is a tool that measures the amount of traffic a website receives. It provides detailed insights regarding this traffic, such as which pages are receiving the most visitors.
Is Google Analytics for Free?
Yes, Google Analytics is free. However, there is a paid version that costs $15,000 annually.
Is Google Analytics Easy to Learn?
Google Analytics can seem complex, especially to first-time users. However, the basics are not too difficult to pick up.
Does Google Analytics Require Coding?
Using Google Analytics to analyze your website does not require coding. When setting it up, however, Google Analytics shares a tracking code that must be added to your website.
What Do I Need to Use Google Analytics?
In order to use Google Analytics, you will need to create a Google Analytics account.